BOB HARTRANFT | Good Thinking
High School Grades, College Admissions, and Scholarships
7 May 2018 Version
Robert M. Hartranft
Simsbury CT 06070
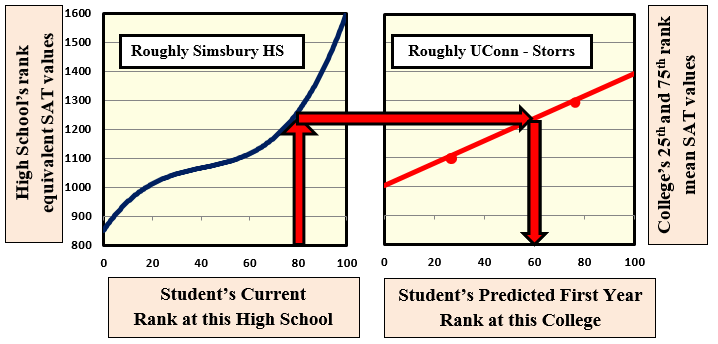
Student’s Predicted first year rank at this College. Basis:
· High School’s existing data.
· College’s published data (·).
Later as Confirmation: Survey of HS’s graduates.
Calculation using Candidate’s equivalent mean HS SAT (M+CR) and linear extrapolation of the College’s published 25th and 75th percentile values (·).
In my earlier work in this area, I focused on deriving a national grading scale. I now realize that predicting a Student’s first year rank at any specified college is much more useful:
· It can be done easily and quickly by any USA Secondary School.
· It is immediately useful to Students, to Secondary Schools, and to Colleges alike.
· A later survey of the Secondary School’s graduates can provide both model applicability confirmation and significant additional insights.
· It minimizes the effects of differing school grading patterns. If computerized, also course, teacher, and year differences.
The older work is described below.
Summary: Existing high school transcripts do not contain enough information to quantitatively predict a candidate’s performance at a specific college. The easiest improvement is to use the existing grades, but convert the class rank to percentile rank. A further improvement would be to retrieve all the students in all the classes taken by the candidate and recalculate the percentile class rank based on the candidate’s actual competitors. In either event, the basis of the prediction is the use of the mean SAT (M + CR) for the candidate’s high school class rank rather than the candidate’s individual scores. This change allows aluation of the candidate in a meaningful context.
The problem: At first glance, it seems that a student’s high school grades should be a strong and easily evaluated predictor of that student’s college grades. But there are over 25,000 high schools in the U.S., and grades actually vary by school, by year, by teacher, and by course (a group I will call here the grade “cohort”). There are over 150,000 new cohorts every year, and while local cohort data is well known to each high school, I cannot find a single instance of cohort data being made public, let alone being provided to colleges in admission applications
It is therefore impossible for a college to quantitatively predict a student’s likely performance, and even a good guess (a process some ironically call “gut-ology”) is practical only with well-established high school/college pairs. For the same reason, colleges cannot put all their candidates on a single, quantitatively-sound scale.
Standardized tests like the SAT and the ACT provide nationally consistent results, but are relatively poor predictors of college grades. As is frequently noted, there is a considerable difference between doing well on a multiple choice test Saturday morning and doing well in a nine month long course with many and varied requirements.
In short, the entire college application/admission process relies on information – the high school transcript – which is hard to interpret at best, and frequently misleading.
Some useful tools and patterns: Academic records are now almost universally digitally stored and readily retrieved for analysis. “PowerSchool” – or its competitors – can easily retrieve all the data for all the cohorts where a student has received a grade, allowing calculation of a student’s class rank whenever desired, and with an algorithm which excludes arbitrary premiums for “honors” courses.
Patterns of class rank vs. SAT are very stable at both high schools and colleges: while individual SAT (Math + Critical Reading) scores show considerable scatter, the best-fit SAT score line barely changes from class to class. The mean SAT (M+CR) of the fiftieth percentile student in a class, for example, is typically within four SAT points of that value for both the preceding and the following class. The shape of the curve is similarly stable, especially at colleges: nearly linear over all but the highest and lowest class ranks.
(This averaging technique is precisely analogous to the method almost universally used in quantum mechanics to find easily observed values by averaging over many quantized values: each student being analogous to a quantum particle like a photon. This made the calculation trivial in my mind, but totally unfamiliar to anyone outside quantum physics: about 99.9% of the population, I would guess. For 16 years, I used the technique unnoted and unexplained, until I finally realized that real people never use or encounter this method.).
Therefore the mean equivalent SAT values for a current rank can be taken from those of the most recently graduated class at that high school.
Further, most American colleges publish the mean SAT scores for their 25th and 75th percentile first year students, and tables of these values are updated every year. Like the earlier values, these values are typically stable from year to year: about 200 SAT points apart, with only slowly changing median values.
By most reports, a typical college application gets about eight minutes of review. Within those precious 480 seconds, the reviewer must assess both the quantitative information like GPA, and the subjective information like essays and recommendations. Making the quantitative task easy
and simple is surely beneficial to all in a process which literally shapes lives, costs the nation many billions of dollars a year, and has so much good and bad potential. This is particularly true as both students and colleges look internationally or nationwide rather than just statewide or regionally.
A proposed solution: The patterns above allow direct prediction of a candidate’s first year rank at a college by finding the class rank at the college with the same mean SAT as the candidate’s high school class rank: see the graph above. This automatically adjusts for:
1. The academic aptitude of the candidate’s actual high school competitors and potential college competitors.
2. The grading patterns of the specific high school cohorts where the candidate earned grades, and,
3. The grading pattern at the college under consideration.
Voila! Local murk becomes specific college clarity.
Note that this method avoids the need to change either the overall grading pattern at the school nor the many cohort patterns.
It is interesting to compare the tracking of potential new students against the (non-) tracking of graduates. Districts understandably work hard to determine exactly who will appear the first day of school, and each student’s program. By contrast, after graduation, most Districts have only casual contact with students, with little or no quantitative reporting. Their college performance is known merely as accumulated anecdotes, ignoring the opportunity to measure their high school preparation by their first year performance in college. This makes it harder for students at low grading schools like Simsbury High School to gain admission to colleges attended by their performance peers. And it significantly reduces their chances for scholarships.
DRAFT — For Illustration Only
SIMSBURY HIGH SCHOOL
PRINTED LETTERHEAD ON 32 LB. BOND PAPER
*** INCLUDE IN APPLICATION TO “SOMEWHERE COLLEGE” ***
 Student
Susan A. Example
Equivalent Nationally Normed GPA
4.10
Projected First Year Class Rank at
Somewhere College
66th percentile from bottom
Prepared 6 May 2018.
/signed/
Hope R. Eternal
Guidance Counselor
| The page has been viewed 1418 times |